

Key Highlights
- Portfolio building is a long-term strategy, not a collection strategy. One well-structured property every three to five years compounds faster than three poorly structured ones acquired in a hurry
- Equity is the primary funding mechanism for most portfolios. After the first property, almost every additional purchase is funded from accumulated equity rather than fresh savings
- Loan structure determines the portfolio ceiling. Cross-collateralisation and single-lender concentration cap how far you can go, separate securities and diversified lenders extend the runway
- South East Queensland has structural tailwinds through 2032 that most national markets do not: $7.1 billion in Olympic venue infrastructure plus $12.4 billion in transport upgrades plus sustained interstate migration underpin the Springfield, Ipswich, Logan and Moreton Bay growth corridor
- The APRA 3 per cent serviceability buffer and the new debt-to-income cap from February 2026 limit how quickly you can scale. Strategy, structure, and lender selection matter more than ever
Most property investors in Australia never own more than one investment property. The ones who do are rarely the ones with the highest incomes. They are the ones who understood, early on, that portfolio building is a structural problem: how to fund deposits without saving them, how to hold debt that the bank will continue approving, and how to pick properties whose growth and cashflow compound rather than cancel out.
This guide walks through how to actually do it. Not the Instagram version with six properties by thirty, but the realistic version that most working households can follow over a 15 to 25 year horizon. It covers the five funding strategies that work in 2026, the lending rules that now cap how fast you can scale, and why South East Queensland sits at the centre of almost every serious portfolio conversation this decade.
Logan Stanford, the founder of Stanford Financial, bought his first investment property before the age of 25 using equity from a residential home. Three and a half years later he bought the second. The pattern that followed is the one most portfolio investors end up running, whether they set out to or not: buy, wait for equity, refinance, buy again.
Stanford Financial arranges portfolio lending for investors across Queensland and Australia wide. Book a free portfolio assessment
What a Property Portfolio Actually Is
A property portfolio is three or more investment properties held for long-term wealth creation. The definition matters because it sets the lens. Two properties is a diversified household. Three or more is something that starts needing its own strategy: its own loan structure, its own cashflow model, its own ownership decisions.
The mistake most investors make at property two or three is treating each purchase as a standalone transaction. They buy the property, take the loan the bank offers at the time, and only discover the consequences when they try to buy the fourth or the fifth and the bank says no.
A coherent portfolio has three features. Every property has a role: some are there for capital growth, some for cashflow, some for tax efficiency. The loans are structured so one sale or refinance does not collapse the rest. And the investor can answer, with numbers, the question: what is the plan with this asset base in 10 years?
The Three Pillars of Portfolio Building
Every question a broker asks about a next purchase comes back to three constraints. Deposit, serviceability, and structure. Get all three right and the portfolio continues. Get any one wrong and it stalls.
Pillar 1: Deposit funding
After the first property, almost no investor funds deposits from savings. The maths does not support it. Saving a 20 per cent deposit plus buying costs for a $650,000 property takes around $160,000 in post-tax income. Few working households save that much in the three to five year window that equity typically takes to build.
Instead, most portfolios grow from equity release. You refinance an existing property, unlock the useable equity, and use it as the deposit on the next purchase. The equity release blog covers this in depth, including how to calculate useable equity and how to structure the release so the interest remains tax-deductible.
Pillar 2: Serviceability
Serviceability is whether the bank believes you can afford the repayments on all of your loans combined, assessed at rates higher than what you will actually pay. APRA currently requires lenders to stress-test borrowers at a rate three percentage points above the actual loan rate. On a loan at 6 per cent, the bank assesses you as if you were paying 9 per cent.
For portfolio investors, this is the constraint that usually bites before deposit. Each additional property adds debt to the assessment, and even with rental income coming in, lenders typically only recognise 70 to 80 per cent of that rent for serviceability purposes. The rest is shaded out to allow for vacancy, management fees, and rate rises.
Pillar 3: Structure
Structure is how the debt is held: which properties secure which loans, which lenders hold which debt, whether ownership is personal or in a trust or company, and whether interest is deductible against rental income or non-deductible against your home.
Structure sounds technical but it is ultimately what determines how many properties the portfolio can eventually hold. A cross-collateralised portfolio with all loans at one bank hits a hard ceiling around two or three properties. A properly structured portfolio with separate securities and diversified lenders can hold five, seven, sometimes more.
The Five Strategies That Compound
Most successful Australian portfolios are built using one or a combination of five core strategies. Each has a different risk profile, different capital requirement, and different speed of scaling.
1. The equity release strategy
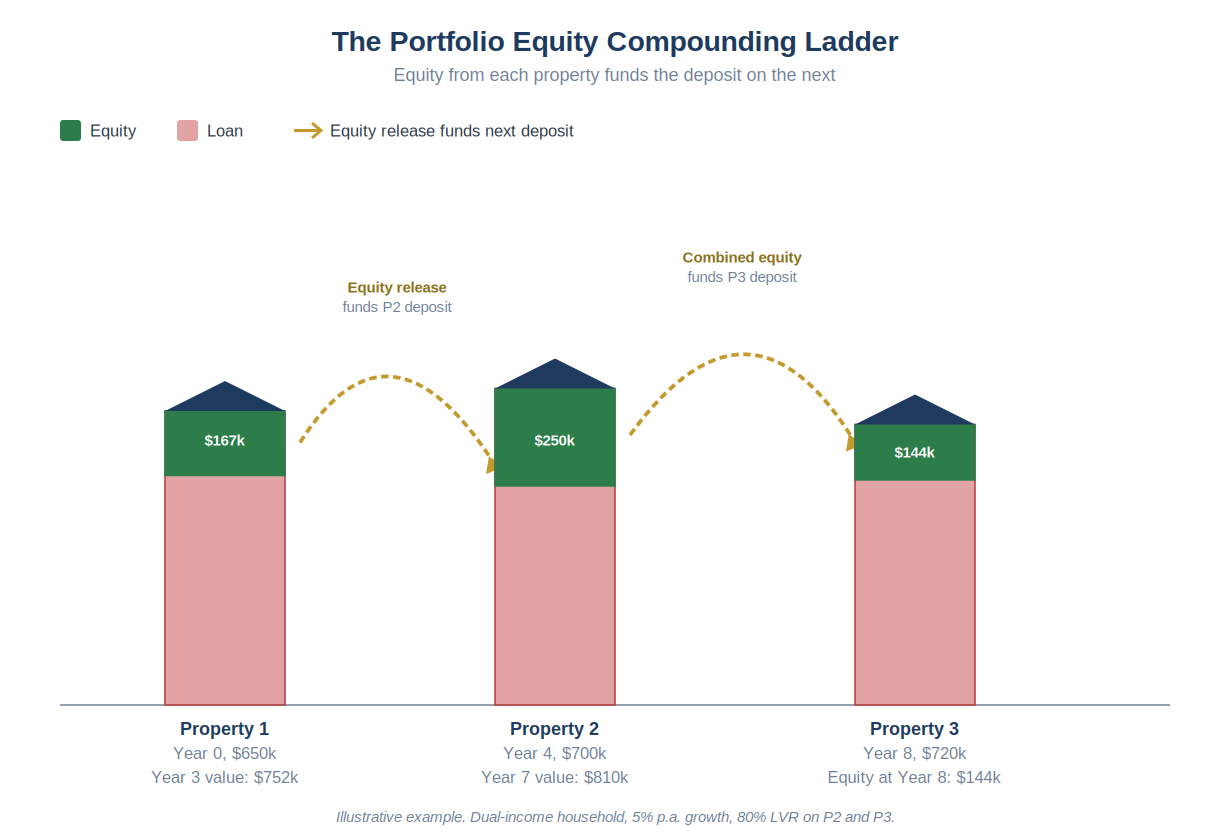
The most common path. Buy property one, wait for growth and principal reduction to build equity, refinance to release that equity, use it as the deposit on property two. Repeat on a three to five year cycle.
This strategy works in almost any market, in almost any location, because it relies on long-term growth rather than short-term market timing. It is also the strategy most sensitive to loan structure. Cross-collateralising property one against property two collapses the strategy at property three or four. Keeping securities separate from the start extends the runway.
2. The cashflow strategy
Buy properties with rental yields that cover or exceed holding costs after interest, management, and maintenance. The aim is a portfolio where every property is neutral or positive on cashflow, so serviceability does not deteriorate with each addition.
Outer Brisbane, Ipswich, and Logan corridor houses at current yields of 4 to 5 per cent sit near the cashflow-neutral line when interest rates are below around 5.5 per cent. Regional Queensland markets (Rockhampton, Townsville, Mackay) often sit in positive cashflow territory at yields above 6 per cent, typically with lower long-term capital growth.
3. The new build and depreciation strategy
Buy brand new properties, typically house and land or off-the-plan apartments, and use the tax-deductible depreciation on the building and fittings to increase after-tax cashflow. A new $650,000 property might generate $4,000 to $8,000 in annual depreciation deductions in the first five years, reducing the out-of-pocket holding cost considerably.
The trade-off is usually purchase premium. New properties often sell at a 10 to 15 per cent premium over equivalent established stock in the same suburb, and that premium erodes as the property ages. The strategy works best for higher-income investors where the tax saving outweighs the premium.
4. The value-add strategy
Buy properties below market value and add value through renovation, subdivision, or development. The equity created is independent of general market movement, which means the strategy can compound regardless of what the broader market does.
The trade-off is capital, time, and risk. Subdivision and small-scale development require expertise, holding costs during the process, and council approvals that can blow out timelines. The strategy works best for investors with time, tolerance for complexity, and access to trade networks.
5. The diversified structure strategy
Hold properties across different states, different markets, and different ownership structures (personal, trust, SMSF). The aim is to reduce concentration risk and optimise tax and asset protection as the portfolio grows.
This typically layers on once the portfolio reaches three or four properties. It is not a starting strategy. But it is the strategy that distinguishes portfolios built to five, seven, or ten properties from those that stall at three.
The Numbers That Set Your Ceiling
Every portfolio has a natural ceiling set by lending rules, and those rules changed meaningfully in February 2026.
The APRA 3 per cent serviceability buffer
Since late 2021, APRA has required all regulated lenders to assess borrowers at an interest rate three percentage points above the actual loan rate. This buffer reduces maximum borrowing capacity by around 15 to 20 per cent for most investors, and it applies to every loan the borrower holds, not just the one being applied for.
For portfolio investors this compounds. Each additional property adds debt to the assessment at the buffered rate, and rental income only partially offsets it (typically at 70 to 80 per cent of actual rent).
The new DTI cap from February 2026
From 1 February 2026, APRA has capped the share of new loans that regulated banks can issue to borrowers with a debt-to-income ratio of six times income or higher. The cap is 20 per cent of new lending across each bank’s book. The rule does not prevent any individual from borrowing above 6x DTI, but it limits how much of the banks’ book can sit there, which in practice means banks are more selective at the upper end.
Portfolio investors are the cohort most affected. By property three or four, total debt relative to income often pushes above 6x. The workaround is not cheating the ratio. It is understanding that non-bank lenders (which are not regulated by APRA and therefore not subject to the DTI cap) often become part of a serious portfolio’s lender mix from property three onwards.
Rental income shading
Lenders typically use 70 to 80 per cent of gross rental income for serviceability. A property earning $600 per week ($31,200 per year) contributes only $21,800 to $25,000 of income to the assessment. This is not negotiable with any individual lender, but different lenders apply different shading percentages, and that 10 per cent spread can be the difference between approval and decline on a portfolio purchase.
What this means in practice
For a dual-income household with $250,000 combined pre-tax income, no HECS, no credit card limits, and a modest existing home loan, the realistic borrowing ceiling for a full portfolio across all lenders is roughly $1.5 to $2.2 million in total debt. That translates to two to three investment properties on top of a home, depending on property values and rental yields.
For a household with $180,000 combined income, the ceiling is lower, typically one to two investment properties. For higher-income households, for defence personnel with exempt income components, or for medical and accounting professionals with LMI waivers at 90 per cent LVR, the ceiling extends further.
Where to Invest: The South East Queensland Context
Where you buy matters less over a 25-year holding period than many investors assume. Most Australian capital city markets deliver similar long-run growth (around 5 to 6 per cent per annum nominal). But the decade matters, and this decade favours South East Queensland in a way that is not true of Sydney, Melbourne, or Adelaide.
The infrastructure backdrop
Three things are happening at once in South East Queensland.
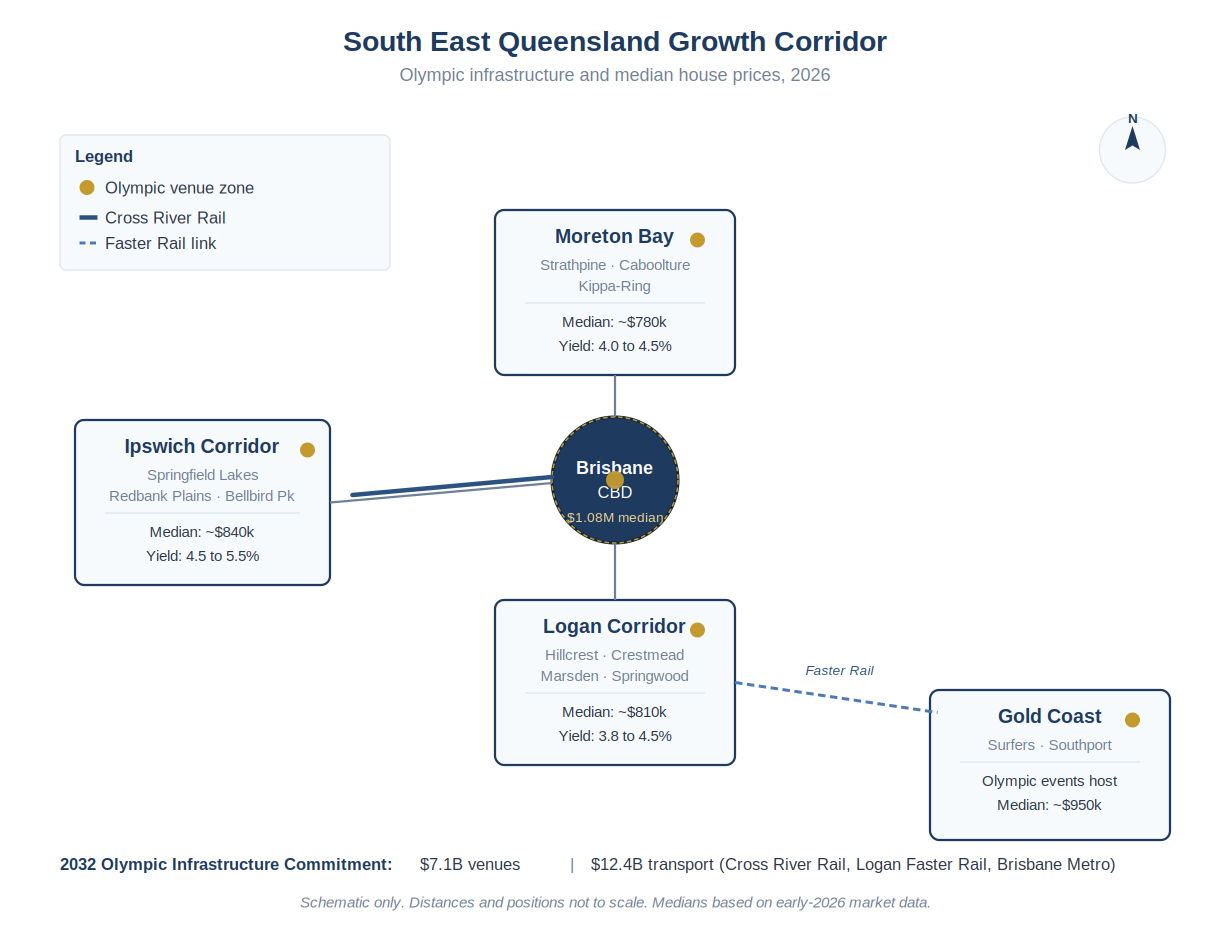
First, the 2032 Olympic and Paralympic Games. The Queensland and Federal Governments have committed $7.1 billion to Olympic venue infrastructure, with events planned for Brisbane, Logan, Ipswich, Moreton Bay, the Sunshine Coast, and the Gold Coast. Second, $12.4 billion in transport infrastructure is planned or already underway, including the Cross River Rail project ($19 billion), the Logan to Gold Coast Faster Rail, and Brisbane Metro. Third, Queensland is absorbing the highest interstate migration in Australia, with population growth forecast to add over one million people to South East Queensland by 2041.
Historical precedent from Sydney 2000 and London 2012 shows property price growth peaking three to five years before the Games rather than after. The 2026 to 2029 window is, on those precedents, the strongest part of the cycle.
The current price and yield landscape
As of early 2026, Brisbane’s median dwelling value sits around $1.08 million after a 17.3 per cent annual increase. That is still meaningfully below Sydney. More relevantly for portfolio investors, the outer corridors remain in the $700,000 to $900,000 range with gross rental yields on houses around 4.0 to 4.5 per cent.
Ipswich houses sit at a median around $840,000 with yields of 4.5 to 5.5 per cent across suburbs like Springfield Lakes, Redbank Plains, and Bellbird Park. Logan corridor suburbs (Hillcrest, Crestmead, Marsden) sit around $800,000 to $825,000 with yields of 3.8 to 4.5 per cent. Moreton Bay (Strathpine, Caboolture, Kippa-Ring) sits in similar territory.
Vacancy rates across most of South East Queensland are below 1.5 per cent, which is structurally tight and the primary reason rents have risen faster than incomes over the last three years.
When to go regional versus metro
Regional Queensland (Rockhampton, Townsville, Mackay, Gladstone, Bundaberg) offers different numbers. Purchase prices are typically $400,000 to $600,000 for freestanding houses, yields are frequently 6 to 7 per cent, but long-term capital growth has been more volatile and often correlated with resource and agricultural cycles rather than population growth.
Regional markets suit cashflow-focused portfolio investors who need positive gearing to maintain serviceability. Metro South East Queensland suits growth-focused portfolio investors with enough income to hold negatively geared properties while capital growth compounds.
The rentvesting angle
An increasing number of South East Queensland portfolios start with rentvesting: renting in Brisbane’s inner ring while buying investment property in affordable outer suburbs or regional Queensland. The rentvesting blog covers this strategy in detail, including the tax position and the first home buyer entitlements that remain available once the rentvestor later buys a home to live in.
Loan Structure for Portfolios
Loan structure is what separates a portfolio that reaches five properties from one that stalls at two. The technical details matter, but the principles come down to four decisions.
Keep securities separate
Cross-collateralisation (where property A is secured against the loan for property B as well as property A’s own loan) feels efficient at the start. It often unlocks a slightly higher LVR, avoids paying LMI, and requires fewer valuations. The cost appears later.
When you want to sell property A or refinance it independently, you discover that the bank holds both properties as security for both loans, and the sale triggers a full portfolio revaluation. Worse, when the same bank later declines your next loan, you cannot easily move the existing debt to a new lender without breaking the cross-collateralisation across both properties.
Keep securities separate from the first investment property onwards. Each loan against only the property it funded, with the deposit (including equity released from another property) structured as a cash contribution.
Diversify lenders
From property three onwards, spreading debt across multiple lenders becomes a portfolio protection strategy. It reduces concentration risk (one bank’s policy change cannot lock the whole portfolio), it captures different lenders’ stronger policies for different property types, and it provides access to non-bank lenders that are not subject to APRA’s DTI cap.
Use interest only strategically
Interest only repayments free up cashflow during the accumulation phase of the portfolio, which supports serviceability for the next purchase. The interest only versus principal and interest blog covers the trade-offs in detail.
Interest only is not automatically the right choice. It is the right choice when the investor has a plan for how the loan balance will eventually be reduced (sale, refinance, principal payments later in life, or equity release for offset account funding).
Keep debt structure tax-efficient
Interest on investment property loans is tax-deductible. Interest on personal debt (home loan, car loan, personal loan) is not. Portfolio structure should make debt non-deductible where possible and keep as much debt deductible as possible. In practical terms: pay down the home loan aggressively, park spare cash in an offset account against the home loan rather than the investment loans, and use equity release structured as separate loan splits so the deductible and non-deductible portions are cleanly identifiable.
A Realistic Portfolio Timeline
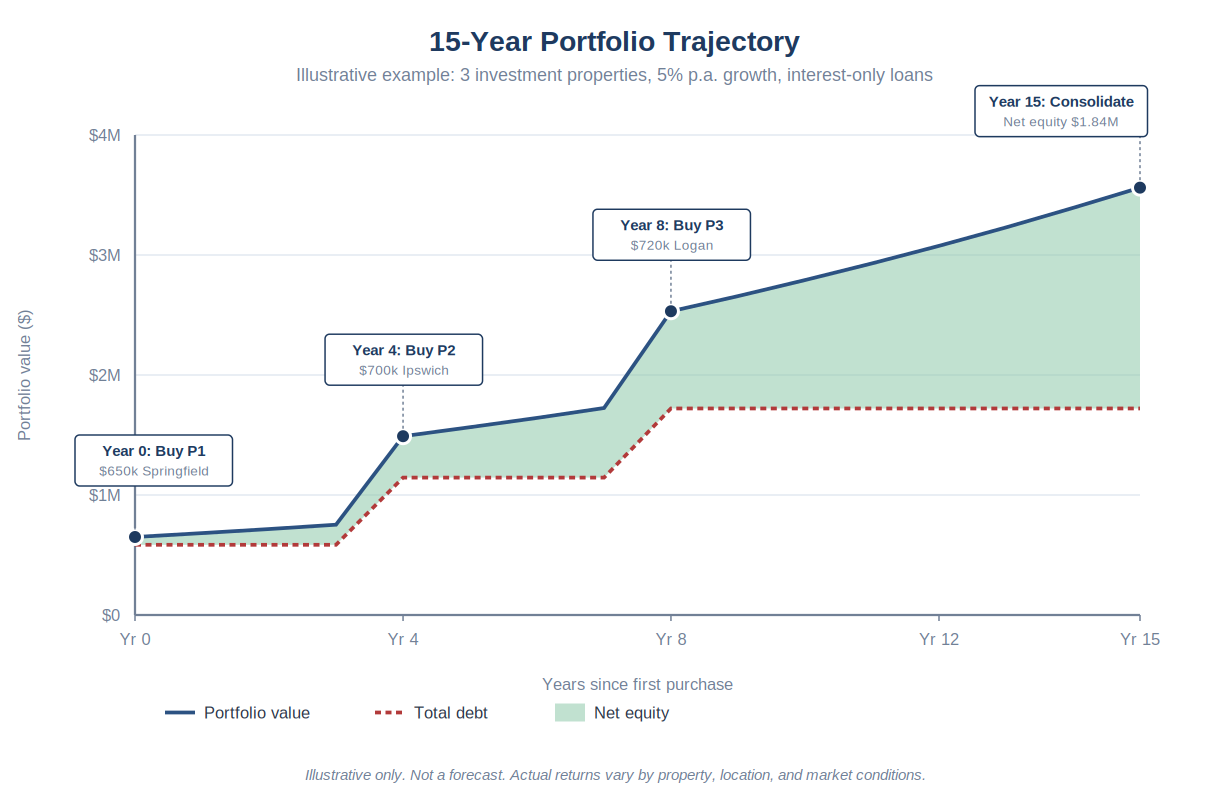
Here is what a realistic, conservatively built portfolio looks like for a dual-income household with combined income of $220,000 and an existing home with $150,000 in equity. The timeline is 15 years. The numbers are illustrative and rounded, and rest on a 5 per cent per annum growth assumption consistent with 30-year Brisbane averages.
Year 0: First investment property
Buy a $650,000 house in Springfield Lakes. Loan $585,000 (90 per cent LVR with LMI or 80 per cent LVR using $130,000 deposit from home equity plus savings). Interest only, 5-year term. Rent $590 per week (yield around 4.7 per cent). Weekly holding cost after tax for a $150,000 marginal income earner: around $60 to $90.
Year 3: Equity review
Property grows at an assumed 5 per cent annual rate to approximately $752,000. Loan balance still $585,000 (interest only). Useable equity: 80 per cent of value minus loan, which is approximately $601,600 minus $585,000 = $16,600. Not quite enough for property two on its own.
Home value has grown to around $1,000,000 from $850,000, adding $120,000 to useable home equity. Combined available: $136,000.
Year 4: Second investment property
Buy a $700,000 property in Ipswich (Redbank Plains or similar). Fund deposit and costs (about $140,000) from the combined equity release. Loan structure: separate security, different lender, interest only. Rent $680 per week.
Year 7: Portfolio review
Both investment properties have grown. Property one at approximately $870,000, Property two at approximately $810,000. Combined useable investment equity around $80,000. Home equity has added a further $150,000. Total available: $230,000.
Year 8: Third investment property
Buy a $720,000 property in the Logan corridor or Moreton Bay. Deposit from combined equity. Third lender (non-bank if DTI is tight). Total portfolio debt approximately $2.1 million. Total portfolio value approximately $3.3 million. Net equity approximately $1.2 million.
Year 15: Decision point
Property values at 5 per cent compound growth: approximately $1.4 million, $1.3 million, $1.1 million. Portfolio value $3.8 million plus the home. Net equity $2 million plus.
At this point most investors stop accumulating and start consolidating. Sell one property, use the profit to pay down debt on the others, convert the portfolio to principal and interest, and ride the cashflow to retirement.
Common Mistakes That Stall Portfolios
Chasing yield without growth (or growth without yield)
High-yield regional markets with flat capital growth generate cashflow but do not build net equity. High-growth inner-city markets with low yields build equity but bleed cashflow and eventually break serviceability. A portfolio needs both, usually by holding different properties optimised for each.
The cross-collateralisation trap
Covered above. Still the single most common structural mistake at property two. The short version: it feels efficient at the time and you pay for it at property four.
Single-lender concentration
Having every loan at the same bank feels simple. It also means one bank’s decision about your portfolio controls your options. When you want to refinance or add another property, you are at their mercy. Diversification of lenders is as important as diversification of properties.
Buying before pre-approval
Investment pre-approval is more involved than owner-occupier pre-approval, particularly for portfolios. Getting the pre-approval first (and understanding exactly what the ceiling is) avoids falling in love with a property that serviceability cannot support.
Over-leveraging at the peak of the cycle
Every market has cycles. Buying at the top with a 90 per cent LVR leaves almost no buffer if values soften. Conservative LVRs on later properties, even if they require LMI or slower deposit accumulation, protect the portfolio through the inevitable downturns.
How Stanford Financial Builds Portfolios
Most brokers arrange one loan at a time. Portfolio lending requires a different lens: looking at where the portfolio is heading in five and ten years, not just whether this purchase will settle. Stanford Financial’s approach is to run a full portfolio review before property two, map out the likely lender sequence and structure for the next three to five acquisitions, and maintain the relationships with non-bank lenders that become essential at the upper end of portfolio building.
Steven Beach brings 20 years of experience in finance, including portfolio structuring for defence personnel, medical professionals, accountants, and self-employed business owners. Logan Stanford’s own portfolio experience informs the strategic lens.
A free portfolio assessment takes 30 to 45 minutes and costs nothing.
Call 0483 980 002 or book online.
Frequently asked questions
- How many investment properties do I need to have a portfolio?
Three or more properties held for long-term wealth creation is the working definition. Two properties is still a diversified personal holding. Three or more is where structural decisions (loan architecture, ownership, lender diversification) start materially affecting whether the portfolio can keep growing.
- How long does it take to build a portfolio of three investment properties?
Most realistically-built portfolios reach three investment properties in 8 to 12 years from the first purchase. Faster than that requires either high income and aggressive saving, or specific strategies like development or off-the-plan acquisitions that compress the equity build phase.
- How much income do I need to start a property portfolio in Australia?
For the first investment property, a household income around $100,000 to $120,000 combined is sufficient in most outer Brisbane markets. For a three-property portfolio at current lending rules, most lenders become comfortable from combined income of $180,000 to $220,000 onwards, depending on existing commitments and the mix of properties.
- Is it better to buy property in Brisbane or regionally for investment?
It depends on the role the property plays in the portfolio. Brisbane and the outer corridors (Ipswich, Logan, Moreton Bay) suit growth-focused investors with enough income to negative gear. Regional Queensland (Rockhampton, Townsville, Mackay) suits cashflow-focused investors who need positive gearing to keep serviceability viable. Most mature portfolios include both.
- Can I use my home equity to buy an investment property?
Yes, and it is the most common way experienced investors fund deposits after their first purchase. Most lenders will release up to 80 per cent of the home’s value, minus the outstanding loan balance, as useable equity. That equity is used as the deposit on the next property. Structure matters: the released equity should be in a separate loan split to preserve tax deductibility.
- What is the APRA serviceability buffer and how does it affect my borrowing?
APRA requires regulated lenders to assess your ability to repay every loan at an interest rate three percentage points above the actual loan rate. On a 6 per cent loan, the bank assesses as if you were paying 9 per cent. For portfolio investors, this buffer applies to every loan the borrower holds, which is why borrowing capacity tightens with each additional property.
- What is the new DTI cap from February 2026?
From 1 February 2026, APRA has limited the share of new loans that regulated banks can issue to borrowers with debt-to-income ratios of six times or higher. The cap is 20 per cent of new lending across each bank’s book. This does not ban high-DTI lending, but it makes banks more selective at the upper end. Non-bank lenders are not subject to the cap, which is part of why they feature in most portfolios from property three or four onwards.
- Should I hold investment properties in my personal name or in a trust?
Personal names are simpler and preserve the 50 per cent CGT discount on sale after 12 months. Trusts (especially discretionary trusts) offer asset protection and income distribution flexibility but are more expensive to set up and run, and they do not access the same negative gearing benefits against personal income. Most portfolios start in personal names and only shift to trust structures once scale, asset protection, or succession becomes the priority. Speak with an accountant before deciding.
- Is the Brisbane 2032 Olympics really going to move property prices?
Historical precedent from Sydney 2000 and London 2012 suggests the strongest price growth occurs three to five years before the Games rather than after. The Queensland Government has committed $7.1 billion to venues and $12.4 billion to transport infrastructure across South East Queensland, with events planned for Ipswich, Logan, Moreton Bay, the Sunshine Coast, and the Gold Coast. The 2026 to 2030 window is, on historical precedent, the stronger part of the cycle.